Enterprise Data Integration: How One F&B Group Brought 15 Companies Into One Dashboard
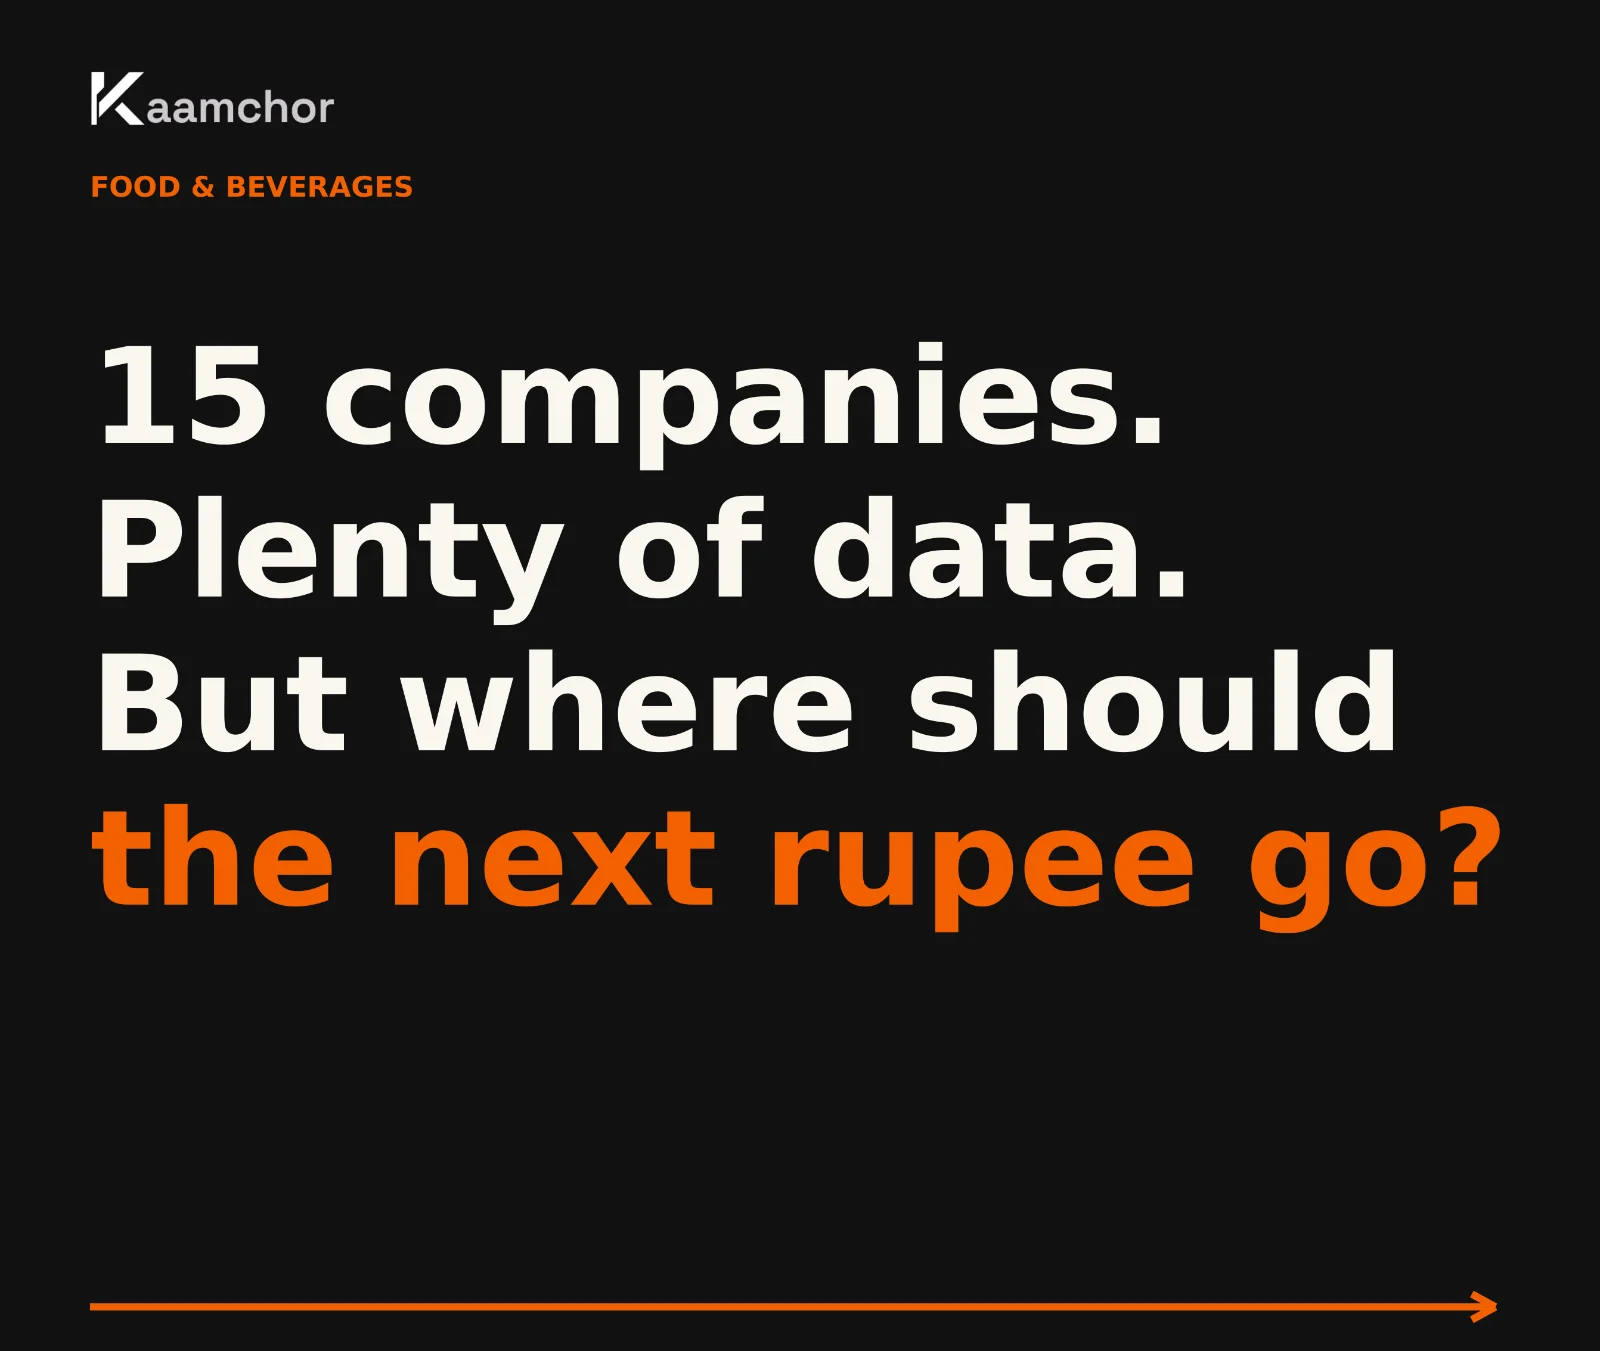
15 companies. Multiple accounting, production and supply chain systems. Plenty of data.#
But where should the next rupee go?
For a food and beverages group managing 15 companies, that question was harder to answer than it should have been. Each operation had its own information. The data existed, but understanding financial performance across the entire group meant looking beyond individual systems and reports.
The challenge wasn't simply collecting more information. It was making existing information useful for decisions about investment, performance and the next phase of growth.
At Kaamchor, we worked with the group to integrate information from its existing systems into a consolidated business intelligence dashboard. The owners could monitor return on investment (ROI) and return on equity (ROE) for each operation from one place.
This enterprise data integration project illustrates an important distinction: connecting business systems is valuable, but the real purpose is helping people make better-informed decisions.
The dashboard was the tool. The decision was the point.
The Business Challenge: 15 Companies, Separate Systems, No Single View of Returns#
Managing one business requires a reasonable understanding of what is happening across finance, operations and supply chains.
Managing 15 companies introduces a different challenge.
An individual company may have accounting records, production information and supply chain data available through its own systems. But when the group owner wants to compare financial performance across operations, those separate views are not necessarily enough.
A report from one business can explain what happened there. It doesn't automatically explain how that performance compares with the other 14 companies.
That distinction matters when capital and resources must be allocated across the group.
Imagine an owner reviewing two operations. One generates considerable revenue but requires substantial investment. Another is smaller but may be using its available capital more efficiently.
Revenue alone cannot settle the investment question. Neither can production volume or an isolated financial report.
The owner needs to understand the relationship between investment, returns and the resources committed to each operation.
For this F&B group, the central problem was therefore not data availability.
It was the absence of a consolidated view that could support decisions across the business group.
Why disconnected business systems create decision-making problems#
Different business functions naturally require different software.
Accounting systems record financial activity. Production systems help teams manage manufacturing operations. Supply chain systems support the movement of materials and products.
Each system may perform its individual job well.
The difficulty arises when leadership needs answers that depend on information from more than one system.
A financial result becomes more meaningful when it can be considered alongside the operation generating it. A production decision may have consequences for working capital. Supply chain requirements may influence how much investment an operation needs.
Without a shared view, leadership has to connect these relationships manually or interpret multiple separate reports.
The information may be technically available while remaining difficult to use.
That is the business problem enterprise data integration is intended to address.
What Is Enterprise Data Integration?#
Enterprise data integration is the process of bringing information from different business systems into a connected, usable view so an organisation can analyse performance and support decisions across functions or operations.
It may involve financial software, enterprise resource planning systems, production applications, supply chain platforms, customer databases or other operational tools.
The objective is not necessarily to replace the systems already in use.
Often, the more practical question is whether those systems can provide the information required for a common reporting and decision-making process.
For a business group, enterprise data integration can help create consistency across companies that otherwise operate with separate software and reporting structures.
However, integration alone is not the same as business intelligence.
Moving information between systems addresses access and connectivity. Turning that information into understandable financial and operational measures addresses interpretation.
Both matter.
Enterprise data integration vs business intelligence#
The two concepts are closely related, but they solve different parts of the problem.
| Enterprise data integrationBusiness intelligence | |
| Connects information from different systems | Helps users analyse and interpret information |
| Addresses fragmented data sources | Addresses fragmented business visibility |
| Supports consistent information access | Supports comparisons, reporting and decisions |
| Creates the foundation for shared reporting | Presents information in a usable format |
A dashboard may be the visible outcome, but its usefulness depends on the information behind it.
If the underlying figures are incomplete, inconsistent or misunderstood, an attractive dashboard can simply make an unreliable answer easier to read.
For Kaamchor's F&B client, the purpose was to connect existing business information with a practical management requirement: understanding returns across operations.
How Kaamchor Approached the 15-Company Challenge#
The project involved a food and beverages group with 15 companies and separate systems covering accounting, production and supply chain operations.
Kaamchor integrated those systems into an owner-facing dashboard that provided visibility into ROI and ROE for each operation.
The available project description establishes the business scope, the system categories involved and the reporting outcome. It does not specify the underlying software products, integration architecture or implementation timeline.
What matters for this case study is how the solution connected the client's existing information to the decisions its owners needed to make.
Step 1: Start with the owner's decision, not the software#
There is a temptation in technology projects to begin with the tool.
Which dashboard platform should we use? Which database should store the information? Which system needs to be replaced?
Those questions may eventually matter, but they do not define the business problem.
For this client, the more useful starting point was:
How can the owners understand where their capital is working across 15 different operations?
That question changes the direction of the project.
Instead of producing another collection of operational reports, the objective becomes creating a view that helps leadership compare financial returns.
It also establishes a clear measure of usefulness: can the owner find the financial context needed to evaluate where resources might go next?
Step 2: Bring the relevant business systems together#
The client's information was distributed across accounting, production and supply chain systems.
Kaamchor's solution brought information from these separate systems into a consolidated dashboard.
This matters because a group-wide financial view cannot be built around one department's perspective alone.
Accounting provides important financial information. Production and supply chain systems provide operational context.
Connecting these sources creates the basis for looking at business performance beyond the boundaries of individual applications.
It is worth distinguishing this project outcome from a broader technical claim. The case study confirms integration into a common dashboard; it does not establish whether the integrations used APIs, scheduled data pipelines, direct database connections or another method.
Step 3: Make ROI and ROE visible across operations#
The resulting dashboard allowed the owners to monitor two financial measures for each operation:
Return on investment (ROI) and return on equity (ROE).
Both are useful when evaluating business performance, but they answer different questions.
ROI examines returns in relation to investment. ROE examines profitability in relation to shareholders' equity.
For an owner managing several companies, having both measures available in a consolidated view provides more financial context than looking at revenue figures alone.
The important achievement was not that the dashboard displayed two abbreviations.
It was that the owners could examine returns across their operations in one place.
Step 4: Connect visibility to resource allocation#
Once the owners can review financial returns across operations, they have a clearer basis for asking questions about the next phase of the group.
Where is capital generating returns?
Which operations deserve closer examination?
Where might additional resources be justified?
Which investments require further analysis before the group commits more money?
The dashboard does not make these decisions automatically.
Nor should ROI and ROE alone determine capital allocation.
Growth potential, risk, cash flow, strategic importance and operational constraints also matter.
But a consolidated view of returns gives leadership a more useful starting point for those discussions.
And that was the purpose of this implementation.
Why ROI and ROE Matter in a Multi-Company Dashboard#
Financial dashboards are only as useful as the decisions their measures help explain.
For a business owner overseeing several operations, the challenge is not simply to know which company earns the most revenue.
It is to understand how effectively different operations use the resources available to them.
Return on investment: Is the investment producing a worthwhile return?#
ROI is commonly used to evaluate the return generated relative to an investment.
A simplified calculation is:
ROI = (Net return ÷ Investment cost) × 100
The exact calculation depends on what is being evaluated and how the organisation defines its investment and return.
Consider a hypothetical example.
An operation generates a net return of ₹20 lakh on an investment of ₹1 crore.
Using the simplified formula, its ROI would be 20%.
That figure becomes more useful when leadership can compare it with other investments using consistent definitions and comparable periods.
However, ROI alone does not capture every consideration. The timing of returns, associated risks and future capital requirements may change the attractiveness of an investment.
Return on equity: What return is being generated on shareholders' equity?#
ROE is generally calculated as:
ROE = (Net income ÷ Average shareholders' equity) × 100
It helps assess profitability relative to the equity invested in a business.
For example, a company with ₹15 lakh in annual net income and ₹75 lakh in average shareholders' equity would have an ROE of 20%.
That does not automatically make it a better investment than another company with a lower ROE.
Debt levels, unusual accounting items and differences in business models can affect the comparison.
For a group dashboard, consistent calculation methods are therefore important.
Why both measures deserve attention#
ROI and ROE provide related but distinct views of performance.
A company may report a strong ROE partly because it operates with substantial financial leverage. Another may generate a healthy return on investment but require significant additional capital to grow.
Looking at one measure in isolation can produce an incomplete picture.
A dashboard that makes both available helps leadership ask more informed questions before deciding where capital should go.
In Kaamchor's project, the confirmed outcome was that the owners could monitor these returns across operations from a consolidated dashboard.
What Changed for the F&B Group?#
The clearest outcome was consolidated financial visibility across 15 companies.
Before the integration, information existed across separate accounting, production and supply chain systems.
After the integration, the owners had a common dashboard for monitoring ROI and ROE across their operations.
That is a meaningful change in how business information can be accessed and interpreted.
| AreaOriginal challengeOutcome | ||
| Business structure | 15 companies with separate systems | Consolidated owner-facing view |
| Information sources | Accounting, production and supply chain systems | Information integrated into one dashboard |
| Financial monitoring | Returns needed to be understood across operations | ROI and ROE visible for each operation |
| Strategic planning | Difficulty seeing the whole picture | Clearer financial context for resource-allocation discussions |
The project materials do not quantify time savings, cost reductions, revenue improvements or increased investment returns.
It would be misleading to assign those outcomes to the implementation without supporting evidence.
The documented result is narrower, but still important: the owners gained a clearer way to monitor returns across the group and use that information when considering future investment decisions.
The difference between having reports and having perspective#
A company can produce reports without giving its leadership a useful perspective on the business.
That is especially true when different teams measure performance in isolation.
A production report may show output. A supply chain report may show procurement or distribution activity. A financial report may show income and expenditure.
Each can be accurate without answering the broader question.
What does all of this mean for the business as a whole?
The value of a consolidated dashboard is that it can bring related information into a form that supports that question.
It reduces the need for owners to mentally assemble the organisation from separate reports.
And it helps move the conversation from what happened inside each department to what leadership should examine next.
What Other Multi-Company Businesses Can Learn From This Case Study#
The underlying challenge is not unique to food and beverages.
Manufacturing groups, retail businesses, hospitality companies, logistics operators and diversified enterprises may all operate with information distributed across multiple applications or companies.
The specific systems and metrics will differ.
But the decision-making problem is often similar: leadership needs a reliable way to understand performance across the organisation.
There are several useful principles to take from the Kaamchor project.
Begin with a question leadership needs answered#
A technology project becomes easier to evaluate when its business purpose is clear.
Instead of starting with a request for a dashboard containing dozens of charts, start with the decisions the organisation struggles to make.
Does leadership need to compare returns across subsidiaries? Understand profitability by product line? Identify working-capital pressure? Evaluate the performance of individual facilities?
Different questions require different information.
The right dashboard is the one designed around those questions.
Define financial metrics consistently#
When comparing multiple companies, definitions matter.
If two operations calculate ROI differently, placing their results side by side does not make them comparable.
Organisations should agree on measurement periods, financial definitions, allocation methods and reporting assumptions before relying on consolidated figures.
This is a general implementation principle, not a claim about a specific technical step taken in the F&B project.
Preserve operational context#
Financial performance does not exist independently of the business producing it.
Production requirements, supply chain conditions, investment cycles and operational constraints can all influence the interpretation of financial results.
A useful reporting system should allow decision-makers to understand what the numbers represent rather than simply display them.
Design for the person making the decision#
An owner's dashboard should not necessarily resemble a departmental operations dashboard.
A production manager may need detailed output and downtime information. A finance manager may need reconciliation and accounting detail.
An owner deciding where to allocate capital needs a view that makes comparisons and exceptions understandable.
The dashboard should therefore be designed around the responsibilities of its users.
Treat the dashboard as a starting point, not an automatic answer#
Better visibility does not eliminate the need for judgment.
An operation with lower current returns may still be strategically important. A business with attractive historical ROI may face future risks that the dashboard cannot fully represent.
The purpose of business intelligence is to improve the information available for decisions, not to pretend those decisions have become effortless.
When Does a Business Need Enterprise Data Integration?#
A business may benefit from enterprise data integration when its important decisions depend on information scattered across different systems.
Common warning signs include leadership teams receiving inconsistent reports, finance teams manually combining figures from multiple companies, and operational data remaining disconnected from financial performance.
Another signal is when a simple question requires substantial effort to answer.
For example:
Which operation is generating the strongest return relative to the resources committed to it?
If answering that question requires gathering files from several teams, reconciling different definitions and building a new spreadsheet every time, the organisation may have a reporting integration problem.
However, integration is not always the first or best solution.
Sometimes the underlying issue is poor data quality, inconsistent financial definitions or an unclear reporting process.
Connecting unreliable information can simply consolidate the unreliability.
A sensible starting point is to identify the decision, inspect the available data, establish the required measures and then determine what technology is needed.
Does Every Business Intelligence Project Need AI?#
No.
Artificial intelligence can be useful for some analytical tasks, but not every business problem requires it.
For a company struggling to understand financial returns across separate systems, reliable data integration and clear reporting may provide more immediate value than a sophisticated AI feature.
An AI model cannot compensate for inconsistent accounting definitions simply by producing a convincing explanation.
Nor does an automatically generated recommendation become trustworthy because it appears in a modern interface.
Before introducing AI into a business intelligence workflow, an organisation should understand whether the underlying data is sufficiently reliable and whether the proposed capability solves a real problem.
Sometimes the difficult work is connecting existing systems and making information understandable.
That work may be less fashionable than launching an AI agent.
It can also be exactly what the business needs.
The Kaamchor Approach: Technology Should Serve the Decision#
There is a difference between delivering software and solving a business problem.
Software can be delivered according to a specification. A business problem requires understanding why that specification matters.
In this F&B project, the objective was not simply to put 15 companies on a screen.
It was to give the owners a clearer understanding of financial returns across their operations.
The integration of accounting, production and supply chain information was the means of achieving that visibility.
The dashboard became the place where those different perspectives could be considered together.
And ROI and ROE became part of the financial context available when discussing future resource allocation.
That is how Kaamchor approaches the value of this work: the technology matters because of the decision it supports.
Conclusion: The Next Rupee Needs a Clearer Picture#
Fifteen companies can generate an enormous amount of information.
But more information does not necessarily make a business easier to understand.
For this food and beverages group, the useful change was bringing existing information together so the owners could monitor financial returns across their operations from one place.
The project did not remove the complexity of running 15 companies.
It made an important part of that complexity more visible.
And when the next question is where to invest, what to prioritise or which operation deserves additional resources, visibility matters.
The dashboard isn't the destination. The decision it supports is.